Introduction
There is an increasing demand for a smart long-only product centered on the commodity space. When most investors think of commodities they are probably only aware of a handful of the commodity futures such a gold and crude oil. The universe of commodities is much more interesting and exciting when taking in a more holistic point of view by increasing the universe of investable assets to a much broader collection of commodities.
The majority of the experience of our team comes from a discretionary fundamental point in view within the grains and oilseeds sectors. Here commodities of interest include wheat, corn and soybeans. We have spent decades refining the relative value methodologies that we employ inside the flagship relative value commodity fund. In this write-up we lay the ground work that has to be done to extend our current understanding of the grains and oilseeds markets to the greater commodity universe in order to create a smart long-only product for our possible investors.
Long Term Drivers of Commodity Markets
It is known that the term structure is the main driver of the long term returns of commodity futures. As a reference see
- Term Structure as the Primary Driver of Long-Term Commodity Futures Returns
- Long-term sources of return in commodity futures markets from the grain markets
- The Strategic and Tactical Value of Commodity Futures
The image below shows the annualised return from long-only positions on the y-axis and the percentage of time the commodity spent in backwardation on the x-axis. The linear regression is a fit to all the points shown and has an increasing slope. This signals that the more time a commodity spends in backwardation the greater its annualised return will be.
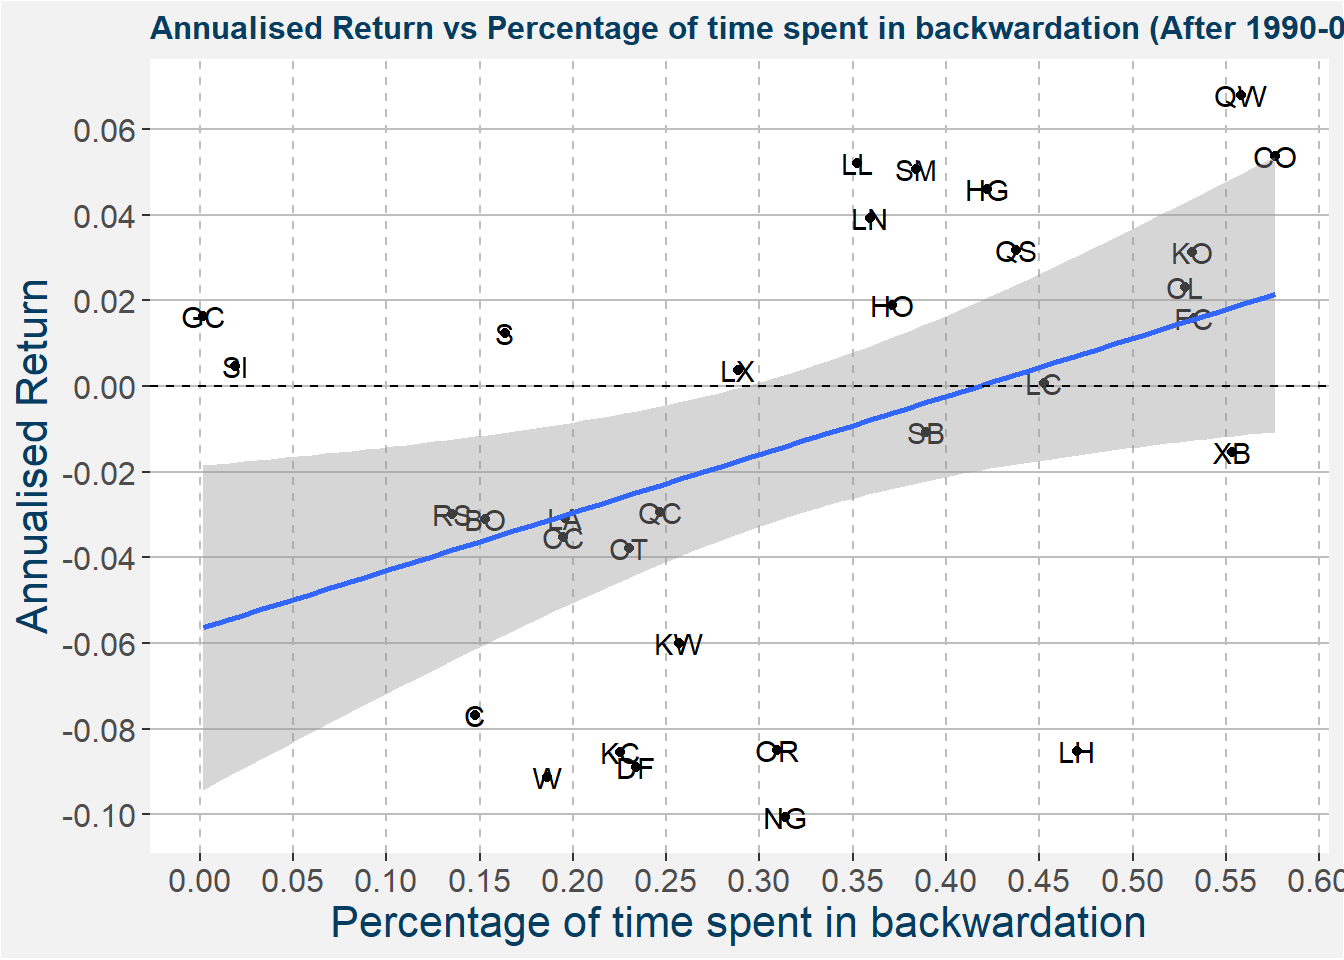
Some commodities do ont adhere to the above outline. Notable exceptions are gold (GC) and silver (SI), both showing positive annualised returns with a majority of time spent in contango. On the other with we have lean hogs, showing a considerable amount of time in backwardation but with only negative annualised returns to show for its efforts.
To create a long-only portfolio of commodidites that gives a positive return over a long term time horizon we have to take the curve structures of the underlying commodities into account. If we are able to forecast the curve shapes with some degree of success this will greatly aid in determining the possible long-only opportunities.
Fundamental Forecasts
Most fundamentals, for the commodities we have historically be involved with, are centered around the supply and demand characteristics of the main consuming and producing nations of the commodity under question. The USDA publishes their estimates of the supply and demand statistics of a collection of commodities in the monthly WASDE reports. These reports are normally published around the 10th of every month. The fundamental analysis them amounts to comparing our forecasts of the supply and demand statistics to those published in the WASDE reports as their projected numbers. If their is a large discrepancy between our supply and demand forecasts compared to those published in the report it signals a possible trading opportunity. Historically we used this methodology to compare the fundamentals of two related commodities to determine which will outperform the other. This same fundamental process can be extended to the long only case, but a proof of principle result will be a good starting stop. Even more so when we want to increase the breadth of opportunities by looking at a much wider range of commodities.
The work of John Alberg and Zachary Lipton is interesting and might serve as an ideal starting point for what we aim to achieve. The paper linked to constructs a factor portfolio of equities by forecasting company fundamentals and uses those values to create standard sorted factor portfolios. They way they went about this problem initially involved creating a clairvoyant future data model to see if their investment thesis still holds up to the scrutiny. Here we propose to perform the same kind of study on the WASDE data.
Two question emerge. Suppose we know the end of season WASDE report supply and demand statistics for all the commodities covered at the beginning of their respective seasons.
- Are we able to guess the price direction correctly?
- Are we able to guess the curve shape correctly?
If both of these questions can be answered in the affirmative then it makes sense, in principle, to create end of season forecasts of the supply and demand statistics of a collection of commodities. If these forecasts imply curve shapes that tend to backwardate or prices to increase it makes sense to include these commodities in a long-only portfolio.
Naturally there are many different input parameters or features, to use the machine learning nomenclature, that could be seen as fundamentals for the different commodity markets. Some commodities, like gold, do not follow supply and demand statistics when it comes to determining price dynamics. In this case the value of the MSCI or S&P together with bond yields might be better indicators. A substantial amount of work will have to go into determining which features are responsible for driving the prices of commodities we have not traded as confidently as the grains and oilseeds.
Curve and Price Models
For each commodity we have to create a model that forecasts
the relevant fundamentals
curve shape
- direction
- magnitude
price move
- direction
- magnitude
These models need not be fully quantitative and may result from pure fundamental and discretionary analysis. The idea is to create a framework within which to think about the possible trades. In the case of models that forecast the direction of the price or curve it will be good if a probability can be associated with the model. This probability can then be used down stream to aid in portfolio construction. When the model forecasts the magnitude of the move this should preferably be expressed as a range of values instead of a single value.
Portfolio Construction
Once we have created quantitative or discretionary models used in forecasting the fundamentals which in turn determine the possible curve structures and price moves we need to construct a portfolio of the available opportunities.
How will position sizes be determined?
- Same downside risk percentage methodology as the relative value fund?
- What about correlations?
- What about different sector weights?
- Stalwart vs new commodities?
- Are we going to use stop losses?
How will we split the quantitative vs discretionary allocations?
What do we do with free cash?
What if there are no available opportunities?
Remarks
The thoughts, processes and ideas outlined above will take some time to flesh out. The results will no doubt be interesting for all our other funds too, so it will most likely be worth the effort.